model#
Bass diffusion model for product adoption forecasting.
The recommended interface is BassModel – a
ModelBuilder subclass with
.fit(), .save(), and .load() methods. The underlying
pm.Model is accessible via model.model for users who want direct
access to the PyMC model object.
The standalone functions F(), f(), and create_bass_model()
are still exposed for direct use.
Adapted from Wiki: https://en.wikipedia.org/wiki/Bass_diffusion_model
The Bass diffusion model, developed by Frank Bass in 1969, is a mathematical model that describes the process of how new products get adopted in a population over time. It is widely used in marketing, forecasting, and innovation studies to predict the adoption rates of new products and technologies.
Mathematical Formulation#
The model is based on a differential equation that describes the rate of adoption:
Where:
\(F(t)\) is the installed base fraction (cumulative proportion of adopters)
\(f(t)\) is the rate of change of the installed base fraction (\(f(t) = F'(t)\))
\(p\) is the coefficient of innovation or external influence
\(q\) is the coefficient of imitation or internal influence
The solution to this equation gives the adoption curve:
The adoption rate at time t is given by:
Key Parameters#
The model has three main parameters:
\(m\): Market potential (total number of eventual adopters)
\(p\): Coefficient of innovation (external influence) - typically 0.01-0.03
\(q\): Coefficient of imitation (internal influence) - typically 0.3-0.5
Parameter Interpretation#
A higher \(p\) value indicates stronger external influence (advertising, marketing)
A higher \(q\) value indicates stronger internal influence (word-of-mouth, social interactions)
The ratio \(q/p\) indicates the relative strength of internal vs. external influences
The peak of adoption occurs at time \(t^* = \frac{\ln(q/p)}{p+q}\)
Applications#
The Bass model has been applied to forecast the adoption of various products and technologies:
Consumer durables (TVs, refrigerators)
Technology products (smartphones, software)
Pharmaceutical products
Entertainment products
Services and subscriptions
This implementation provides a Bayesian version of the Bass model using PyMC, allowing for: - Uncertainty quantification through prior distributions - Hierarchical modeling for multiple products/markets - Extension to incorporate additional factors
Examples#
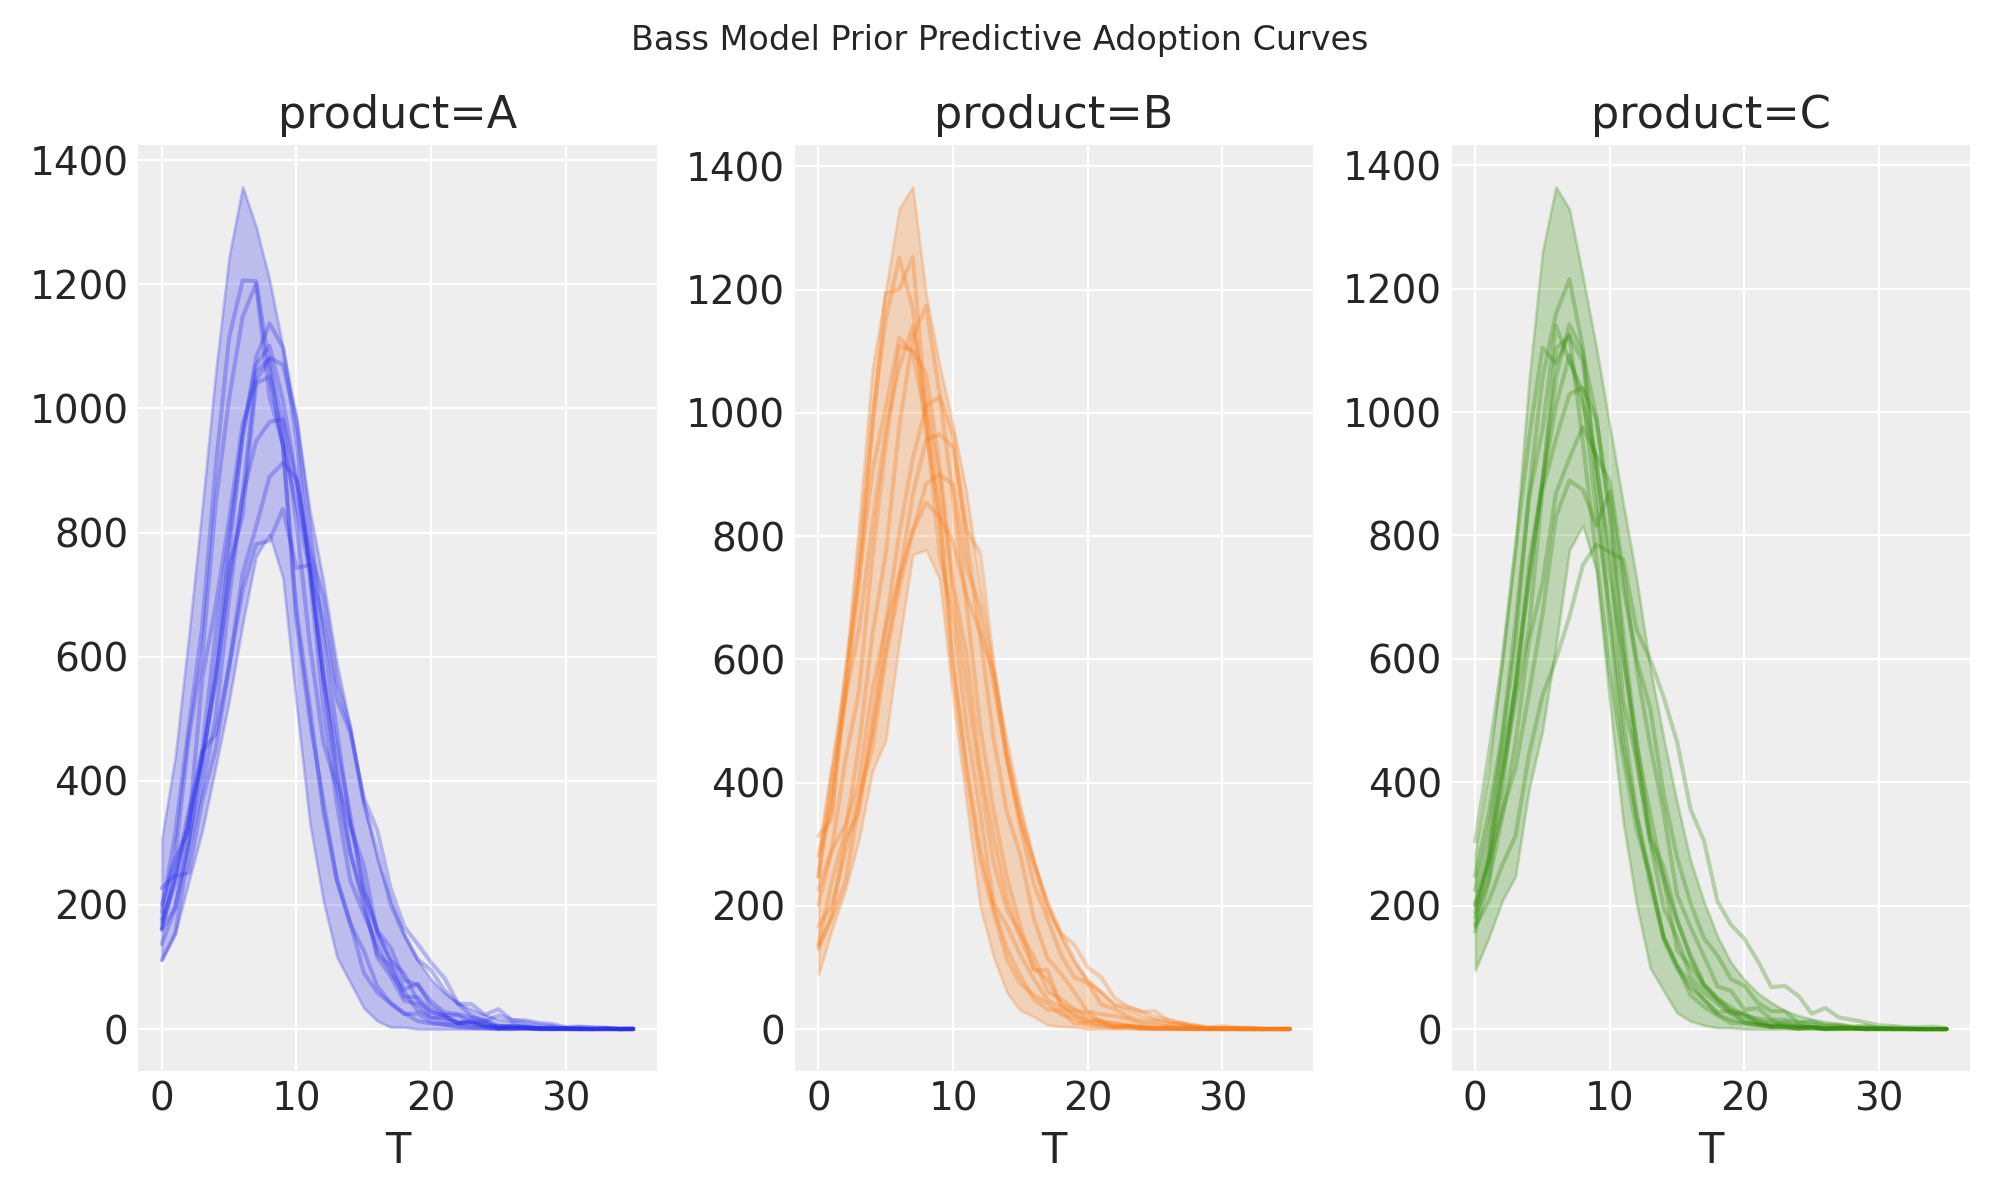
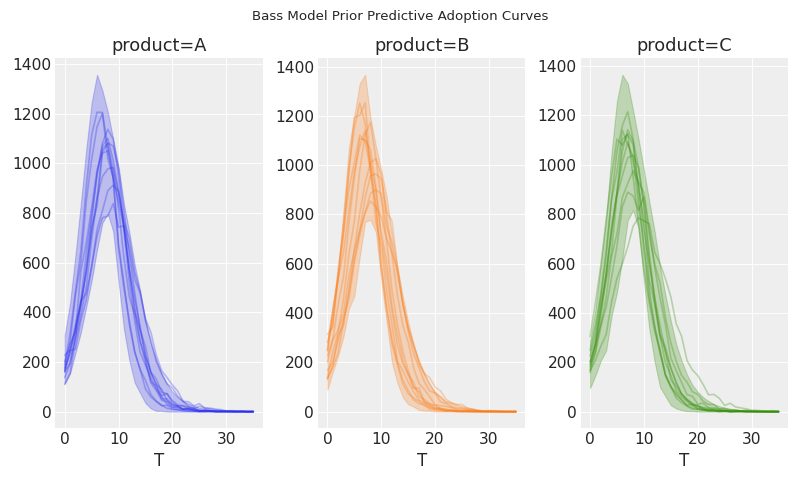
Create a basic Bass model for multiple products:
(Source code, png, hires.png, pdf)
Functions
|
Installed base fraction (cumulative adoption proportion). |
|
Define a Bass diffusion model for product adoption forecasting. |
|
Installed base fraction rate of change (adoption rate). |
Classes
|
Bass diffusion model for product adoption forecasting. |
Priors for the Bass diffusion model. |